Category Archives: History

Historical Land Cover of the United States

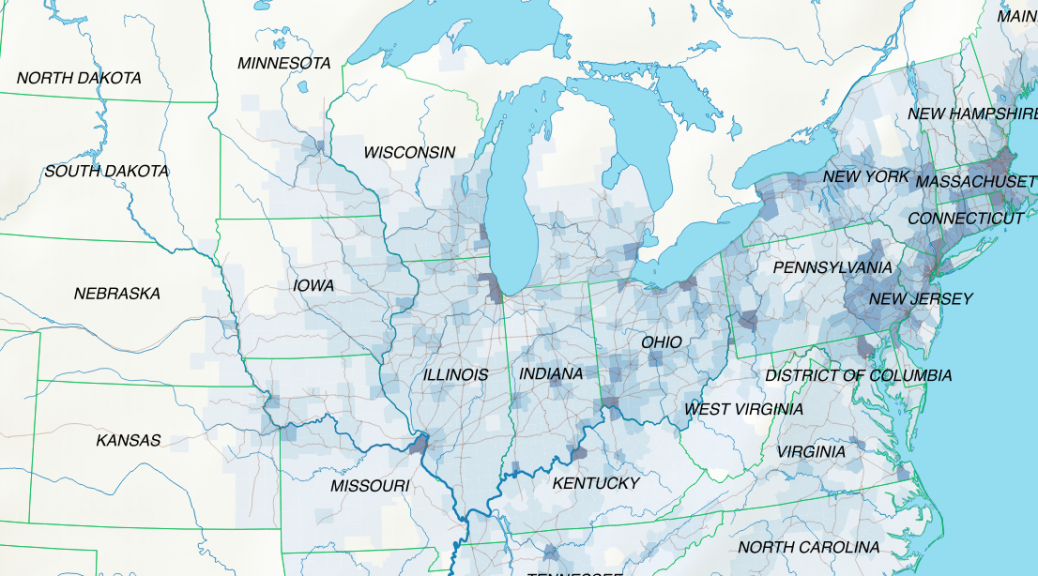
My first map versions used population density and railroads as a proxy for the state and direction of migration. But what about the destination? What was the land cover like at the time of emigration, given the fact that the large majority of emigrating Bührers hauled from the rural countryside and were farmers?
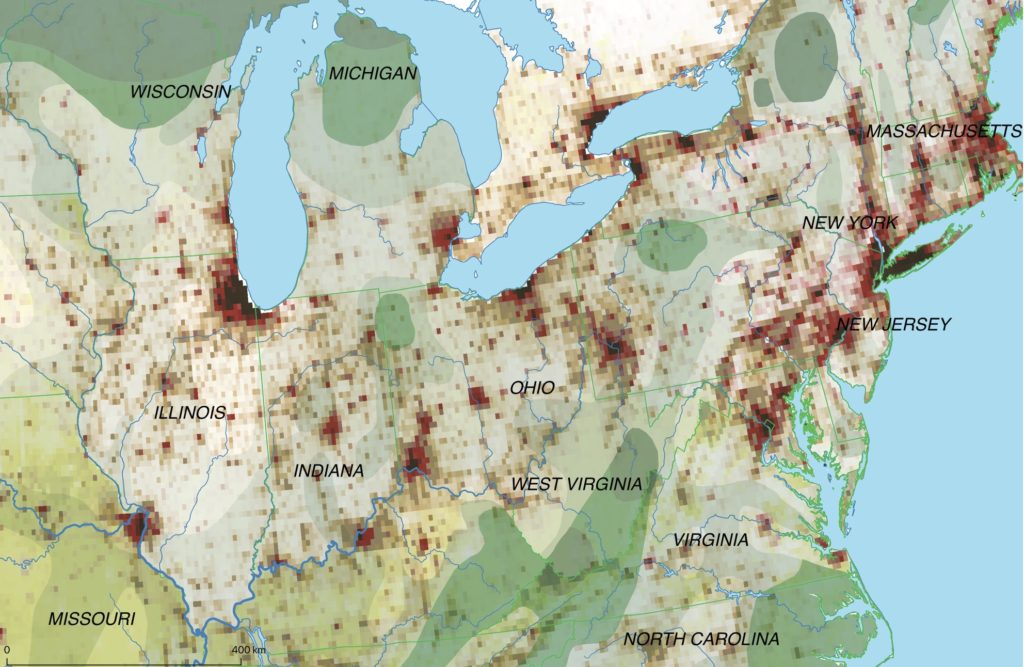
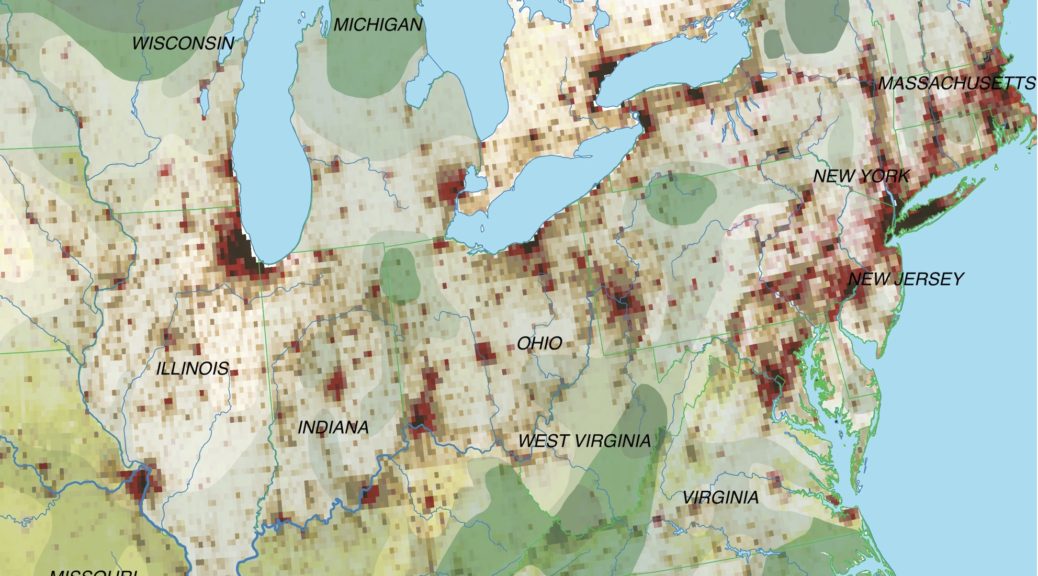
Land cover of the Northeastern United States around 1870

The map above shows the structure of the landcover around 1870. Red indicates urbanised centres, the yellowish green grassland, brown cropland and dark green forestland. Northwestern Ohio was still largely covered by forests (approx. 60% density), with yet only a recognisable patch of cropland around Bryan. Nowadays the forest is – with the exception of small remnants – gone and replaced by cropland. Agriculture completely changed the surface of Ohio.

The sources for this historical land cover were:

Astonishingly I wasn’t able to find period Ohio maps that include land cover information (e.g. forests).
ISLSCP II Historical Land Cover and Land Use, 1700-1990 provides a source for full land cover (https://daac.ornl.gov/ISLSCP_II/guides/historic_landcover_xdeg.html), albeit only at a very low one-degree resolution that wasn’t useful to produce maps. More interesting is Historical Land-Cover Change and Land-Use Conversions Global Dataset (https://data.nodc.noaa.gov/cgi-bin/iso?id=gov.noaa.ncdc:C00814), with half-degree resolution. There is also data for the Original Natural Vegetation of Ohio (https://apps.ohiodnr.gov/gims/report.asp, see theme id 3135), essentially almost exclusively forestland of different kinds.

Bührers’ professions over time

What kind of work did the Bührers live off? A total of 815 Bührers in the dataset (10% of which are women) have profession information ranging from general titles such as “farmer” to  very specific ones like “advanced planning manager at funeral home”.

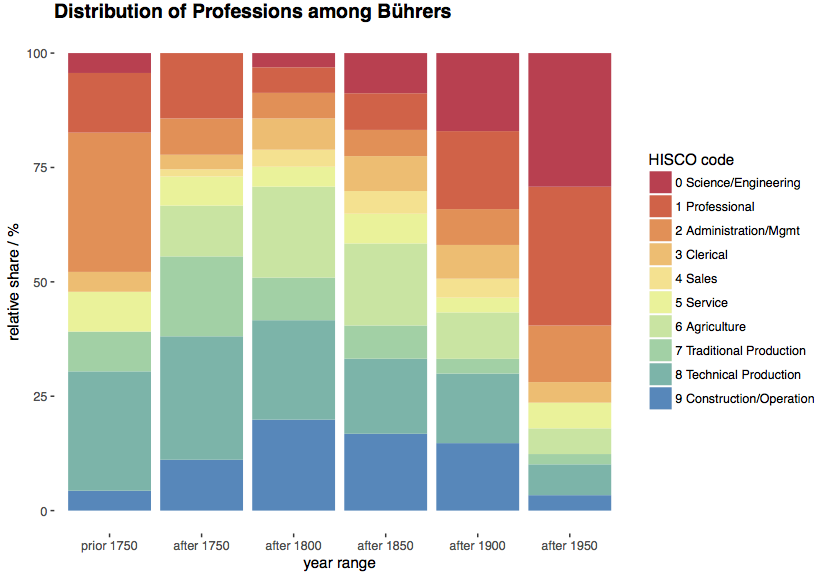
Distribution of professions among Bührers

Professions have been coded with the Historical International Standard Classification of Occupations (HISCO) Tree of Occupational Groups, with modified category names to convey the predominant characteristic of the groups (categories 0-1, 7-9). The number of persons per time slice ranges from 23 (born prior 1750), 63 (born after 1750) up to 262 (born after 1850).

What comes as a surprise is the relatively low share of farmers (category 6) that never exceeded 20%. For most of the time there is a predominant share of production jobs, especially in the 18th and 19th century. Their nature, however, changed over time: e.g. from shoemakers to mechanics (category 8) or carpenters to factory workers (category 9). Not surprisingly some professions have ceased to exist, e.g. “Schalenmacher” (wooden bowl maker).
Women prior the 20th century had expected “woman professions” such as seamstress or nurse, with the odd teacher towards the end of the 19th century. It is only in the 20th century when “Professional, technical and related workers” (categories 0 & 1) become predominant occupations.

There is a clear bias to record/know professions with higher status, e.g. the “Vogt” (the equivalent of a bailiff) that features 6 times for the time slice up to 1750; the same holds true for other professions in the category 2 Administration/Mgmt such as “Gemeindepräsident” (mayor).

How have Bührers spread throughout Switzerland?

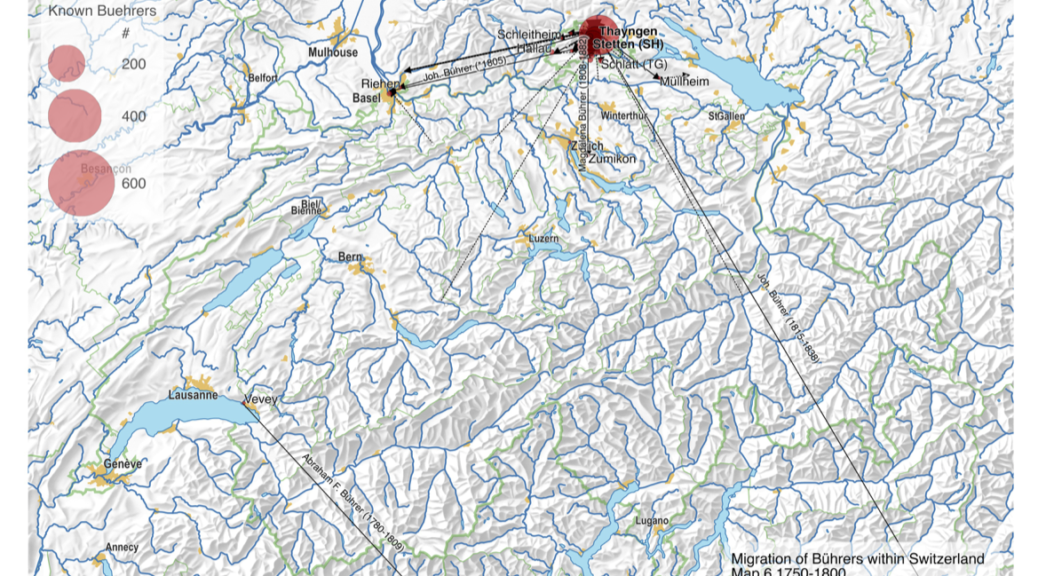
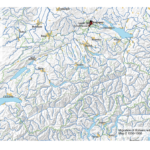
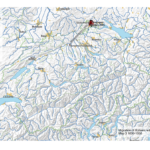
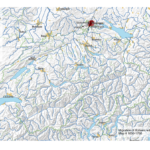
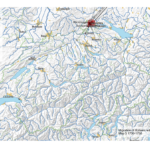
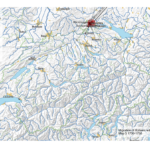
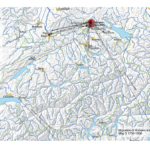
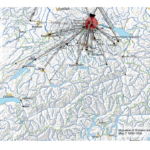
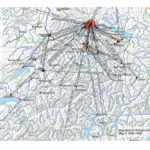
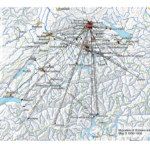
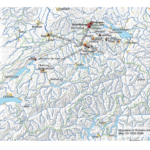
Today, Bührers can be found in various cantons of Switzerland, however, most Bührers still hail from the Canton of Schaffhausen. How did this come about? A time series shows in 50-year steps from 1500 to 2000 (birth dates) where in Switzerland Bührers have been and how they’ve moved.

The earliest recorded Bührer in the dataset is Adam Bührer, who was born around 1533 in Bibern. Long-range migration in earnest starts only in the first of the 19th century.

Note that places have been aggregated at 2018 municipality level (e.g. Bibern and Hofen merged in 2009 with Thayngen). The circle size denotes the number of Bührers.

Analyzing the Bührer dataset

What data of the available Bührer dataset actually made it on one of the maps? A mosaic plot, done with the vcd package from the open source statistical software R (https://www.r-project.org), gives a quick overview over the relevant factors.

Mosaic plot of the Bührer dataset

The plot essentially shows areas proportional to the number of persons, ordered by the emigration status (left) and map # (top). For a given combination the successive blocks in the color red, black and grey denote Named, Married and Descendants persons respectively (see The methodology – preparing genealogical data for maps for explanations). These three categories make up roughly 4’500 persons of the original dataset, with the remainder not being shown. The small circles denote combinations that didn’t occur in the dataset.

A few observations:

  • Only a small fraction of persons in the dataset actually show up on map 1 and 2. This is comes as no surprise, given the large number of e.g. Swiss-based Bührers, “Assumed US” persons as known descendants of emigrants with no place information or “Undetermined” persons where location information could neither be determined nor inferred.
  • The number of Bührers emigrating for the generation prior 1880 (map 1) is significantly larger than the number of emigrating spouses from Switzerland, reflecting the fact that most married once overseas. A look at the category “Third country emigrated to US” indicates that a substantial part of the Bührers – at least for the first generation – preferred to marry other emigrants.
  • There’s very little Bührer emigration happening for the generations born after 1880 (map 2) – almost all Bührers in that period are America-born.

The plot has featured in a small presentation R User Meetup Mosaic plot Thomas Roth 20160803 (includes the R code) in a Zurich R User Group Meetup.

GIS data used in the emigration map project

Data for the emigration map project was – except for the genealogical data – all from public sources. Interestingly enough there is also a relative wealth of sources with relevant historical GIS data.

  • Genealogical data from Swiss Buehrer Web Site as of October 2011 (http://www.myheritage.de/site-72226521/swiss-buehrer). For practical reasons (notably less work for georeferencing) all persons not linked to the main family tree were removed as well as substantial irrelevant side lines like the Finney emigration from Ireland.
  • Digital Elevation Model DEM (30” resolution) from U.S. Geological Survey (ftp://anonymous@edcftp.cr.usgs.gov/data/gtopo30/global/) provided the base for the fairly easy looking smoothed hillshade layer that proved to be the most difficult to produce.
    The four 30” DEM tiles delimited by longitude/latitude (W140N90, W140N40, W100N90 and W100N40) that cover the United States were merged into a single DEM file which was subsequently reprojected and downsampled, all in QGIS.
    In GRASS a moving average was applied to the DEM which was exported as a GeoTIFF. From there, gdaldem was used to generate a hillshade GeoTIFF that received final blurring in Photoshop. Anything but easy.
  • Physical features (1:10 million scale) ocean, coastline, land, rivers and lakes from Natural Earth (http://www.naturalearthdata.com/downloads/)
  • US counties from the US Census Bureau (https://www.census.gov/geo/maps-data/data/cbf/cbf_counties.html)
  • Historical state boundaries (filtered as of 1870) from the Atlas of Historical County Boundaries Project (http://publications.newberry.org/ahcbp/index.html)
  • Historical US railroads (1870) from the Railroads and the Making of Modern America Project (http://railroads.unl.edu/resources/)
  • Historical US census data (1870) from the National Historical Geographic Information System NHGIS of the Minnesota Population Center (https://data2.nhgis.org/downloads). The custom download data included e.g. the number of Swiss-born citizens per county and other interesting data that was not yet used in the project.


Mapping the Emigration of the Bührers from Switzerland to the United States

In the second half of the 19th century many farmers emigrated from the rural communities of the Swiss canton of Schaffhausen, mainly due to a local agricultural crisis and better economic prospects elsewhere. There were emigration peaks around 1850, 1870 and in the 1880’s with a large majority of emigrants heading to the United States. From 1868 to 1890 an equivalent of more than 10% of the canton’s population had left, a large number for Swiss standards at the time.

Among the emigrants were many Bührers from the small hamlets of Bibern, Hofen, Opfertshofen as well as from Herblingen and Stetten in the Reiat region. Originally immigrated from southern Germany the Swiss Bührer at large remained constrained to that tiny corner of Switzerland, which greatly facilitates genealogical research.

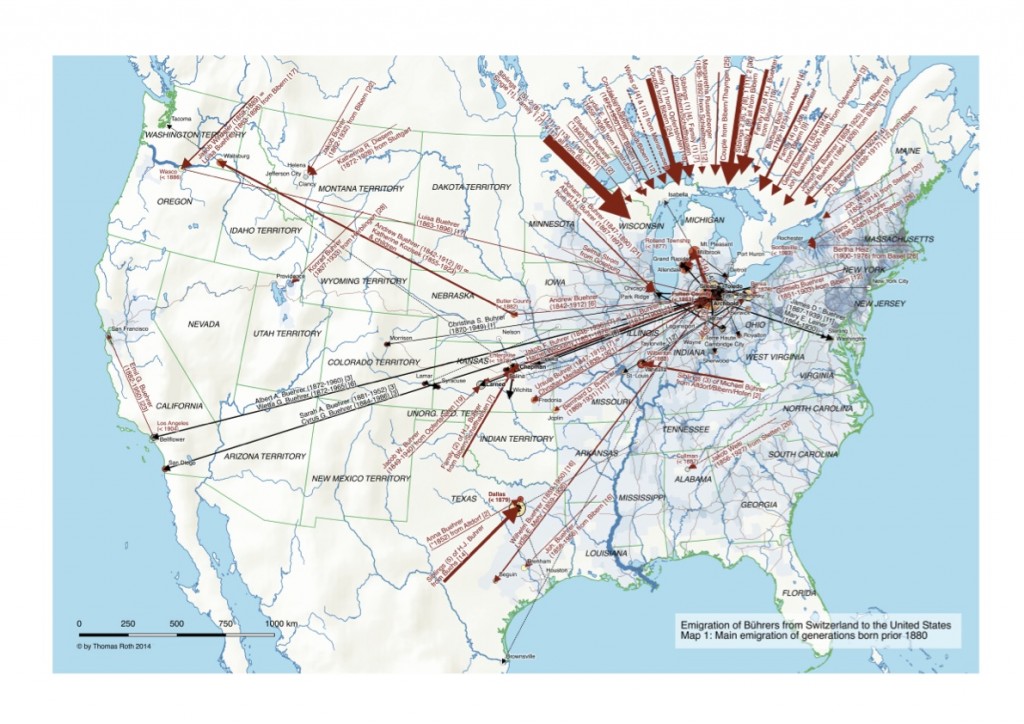
Emigration of Buehrer to the United States - Map 1
Emigration of Buehrer to the United States – Map 1

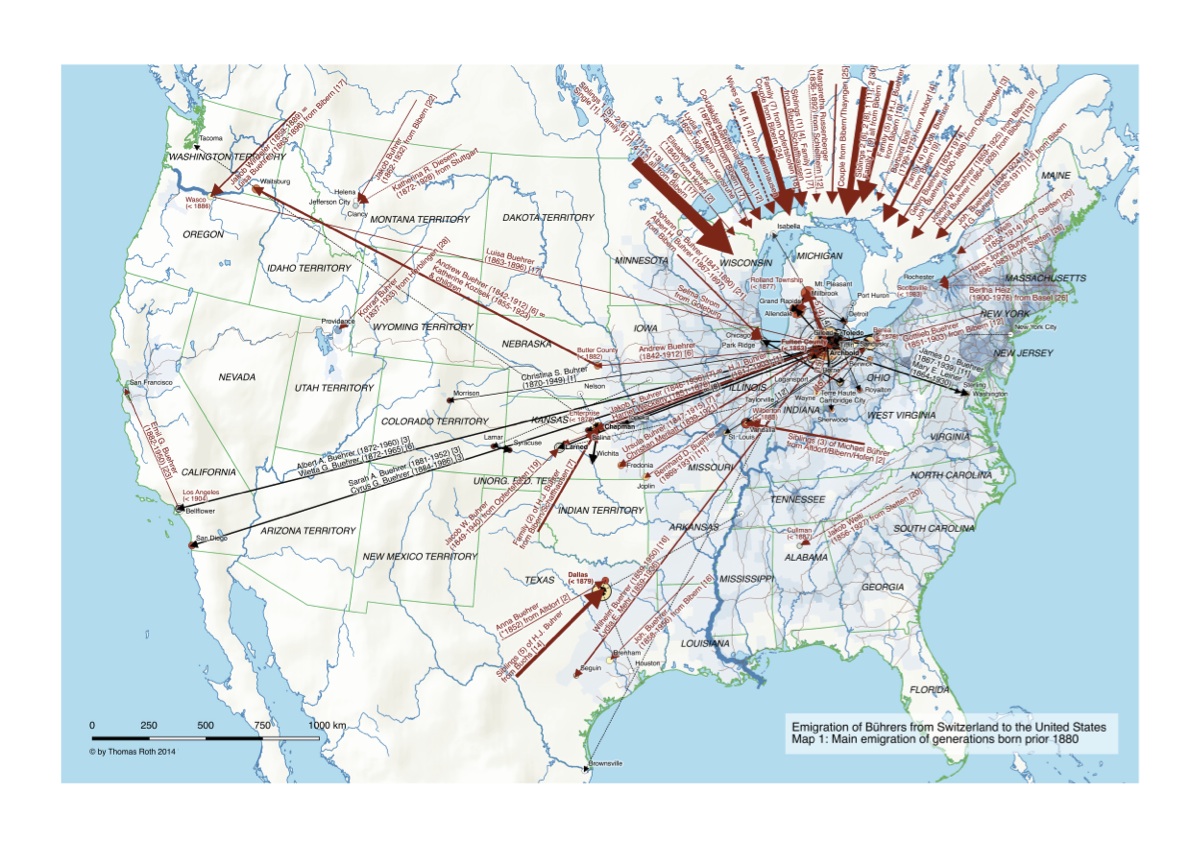
The maps shows the Bührers’ emigration to the United States (Map 1) up to the 1880s and subsequent internal migration up to now (Map 2). Almost all of them initially immigrated to a small area in northwestern Ohio around the city of Archbold in Fulton County; some of them migrated further west to Kansas, Texas or the Pacific Northwest.

In order to provide the necessary historic context Map 1 shows historic state boundaries, population density as well as the railway network (the main mode of transportation for Swiss emigrants) at 1870, the heyday of the Bührer emigration.

Emigration of Buehrer to the United States - Map 2
Emigration of Buehrer to the United States – Map 2

A legend explains the symbology.