Symbology and family references in square brackets are explained in the legend.

Styling of the map was inspired by the Schweizer Weltaltas (http://schweizerweltatlas.ch)
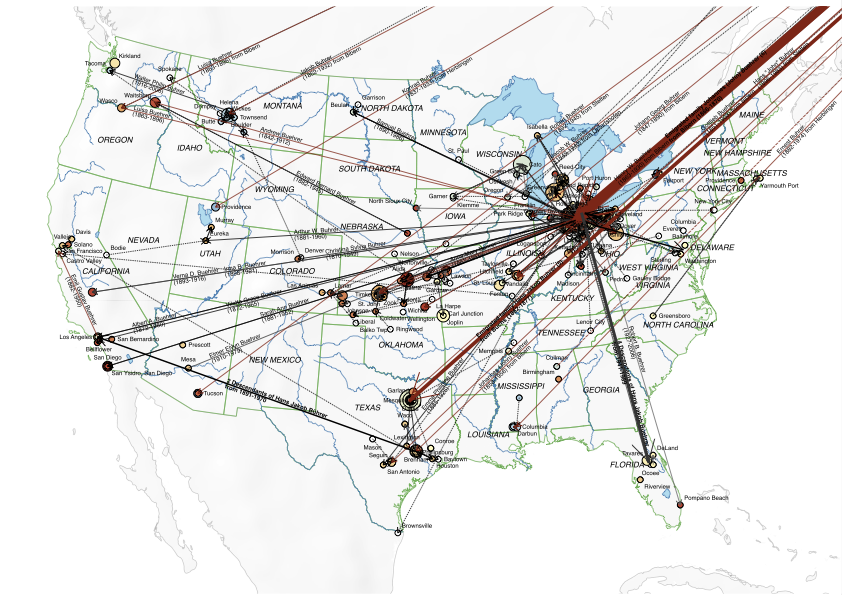
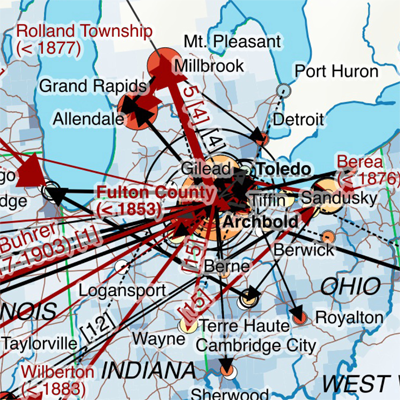
- Migration paths from/to overseas were displayed as point decorations with arrows, with label position and orientation calculated. To minimize clutter in the area in northwestern Ohio all arrows were demoted by a fixed distance and aligned on a circle grouped by destination and origin. Internal migration paths in contrast were real lines. All migration paths made extensive use of data-defined properties to control colour (emigration generation), dashing (person scope), line width (number of persons) as well as the label styling.
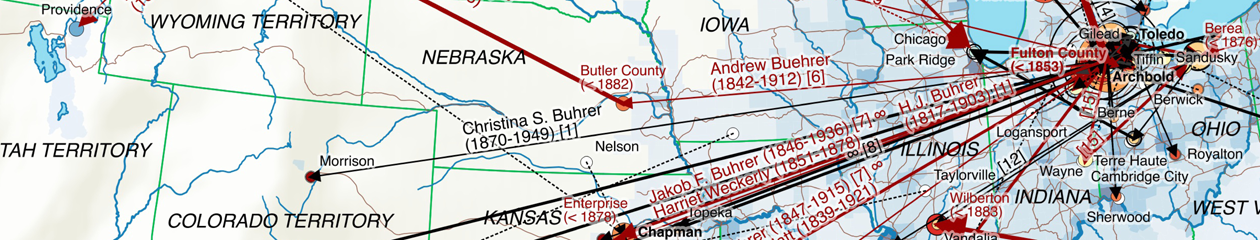
- The number of distinct Bührer persons per county and common ancestry is indicated by the circle size. Distinct common male ancestors having a different colour that increases with their presumed emigration period going from red (early emigrants) to blue (late emigrants).
Counties with Bührers from different ancestry have an additional transparent circle with bold lines to indicate the sum of Bührers. Given the restrictions in QGIS with overlay charts a representation as pie chart was not possible nor practical, given the large number of Bührer persons evidenced e.g. in Fulton County. - A custom label ranking for places was calculated to prevent label cluttering above all in Ohio and to ensure that place names representing the largest Bührer population will prevail.
- Certain label information such as place names in red with first migration evidence in a certain region or labels for first-time migration paths between regions were forced to be always displayed. Label positioning in general and the label text of migration paths in particular was extensively manually tweaked to optimize the map.
Improving content and readability is probably best explained by comparing the final result with an earlier one-map version in QGIS 1.8 where point decorations with arrows were not yet supported.